Fig. 2 - (A) Rank abundance curves of samples grouped
according to the fly’s developmental stage. The lines indicate the
cumulative read abundance (%) while the semi-transparent ribbons show
the standard deviation within each group. (B) Shannon index
calculated for each sample (data points), grouped by the black soldier
fly’s developmental stage (violins). The shape of the data points mark
the type of sample material and the colours indicate their origin.
click figure to see larger version
Fig. 3 - Venn diagrams showing shared ASVs among samples from
various tissues and developmental stages of the black soldier fly.
Shared ASVs in samples (A) grouped by developmental stage as
general overview for community similarities, in (B) larva-derived
samples, in (C) adult-derived samples, and in (D)
egg-derived samples. In (E), samples from adults were compared to
egg samples directly extracted from adults.
click figure to see larger version
Fig. 4 - Linear discriminant analysis of effect size (LefSe).
click figure to see larger version
Supplementary material
Supplementary figure 1 - Heatmap.
click figure to see larger version
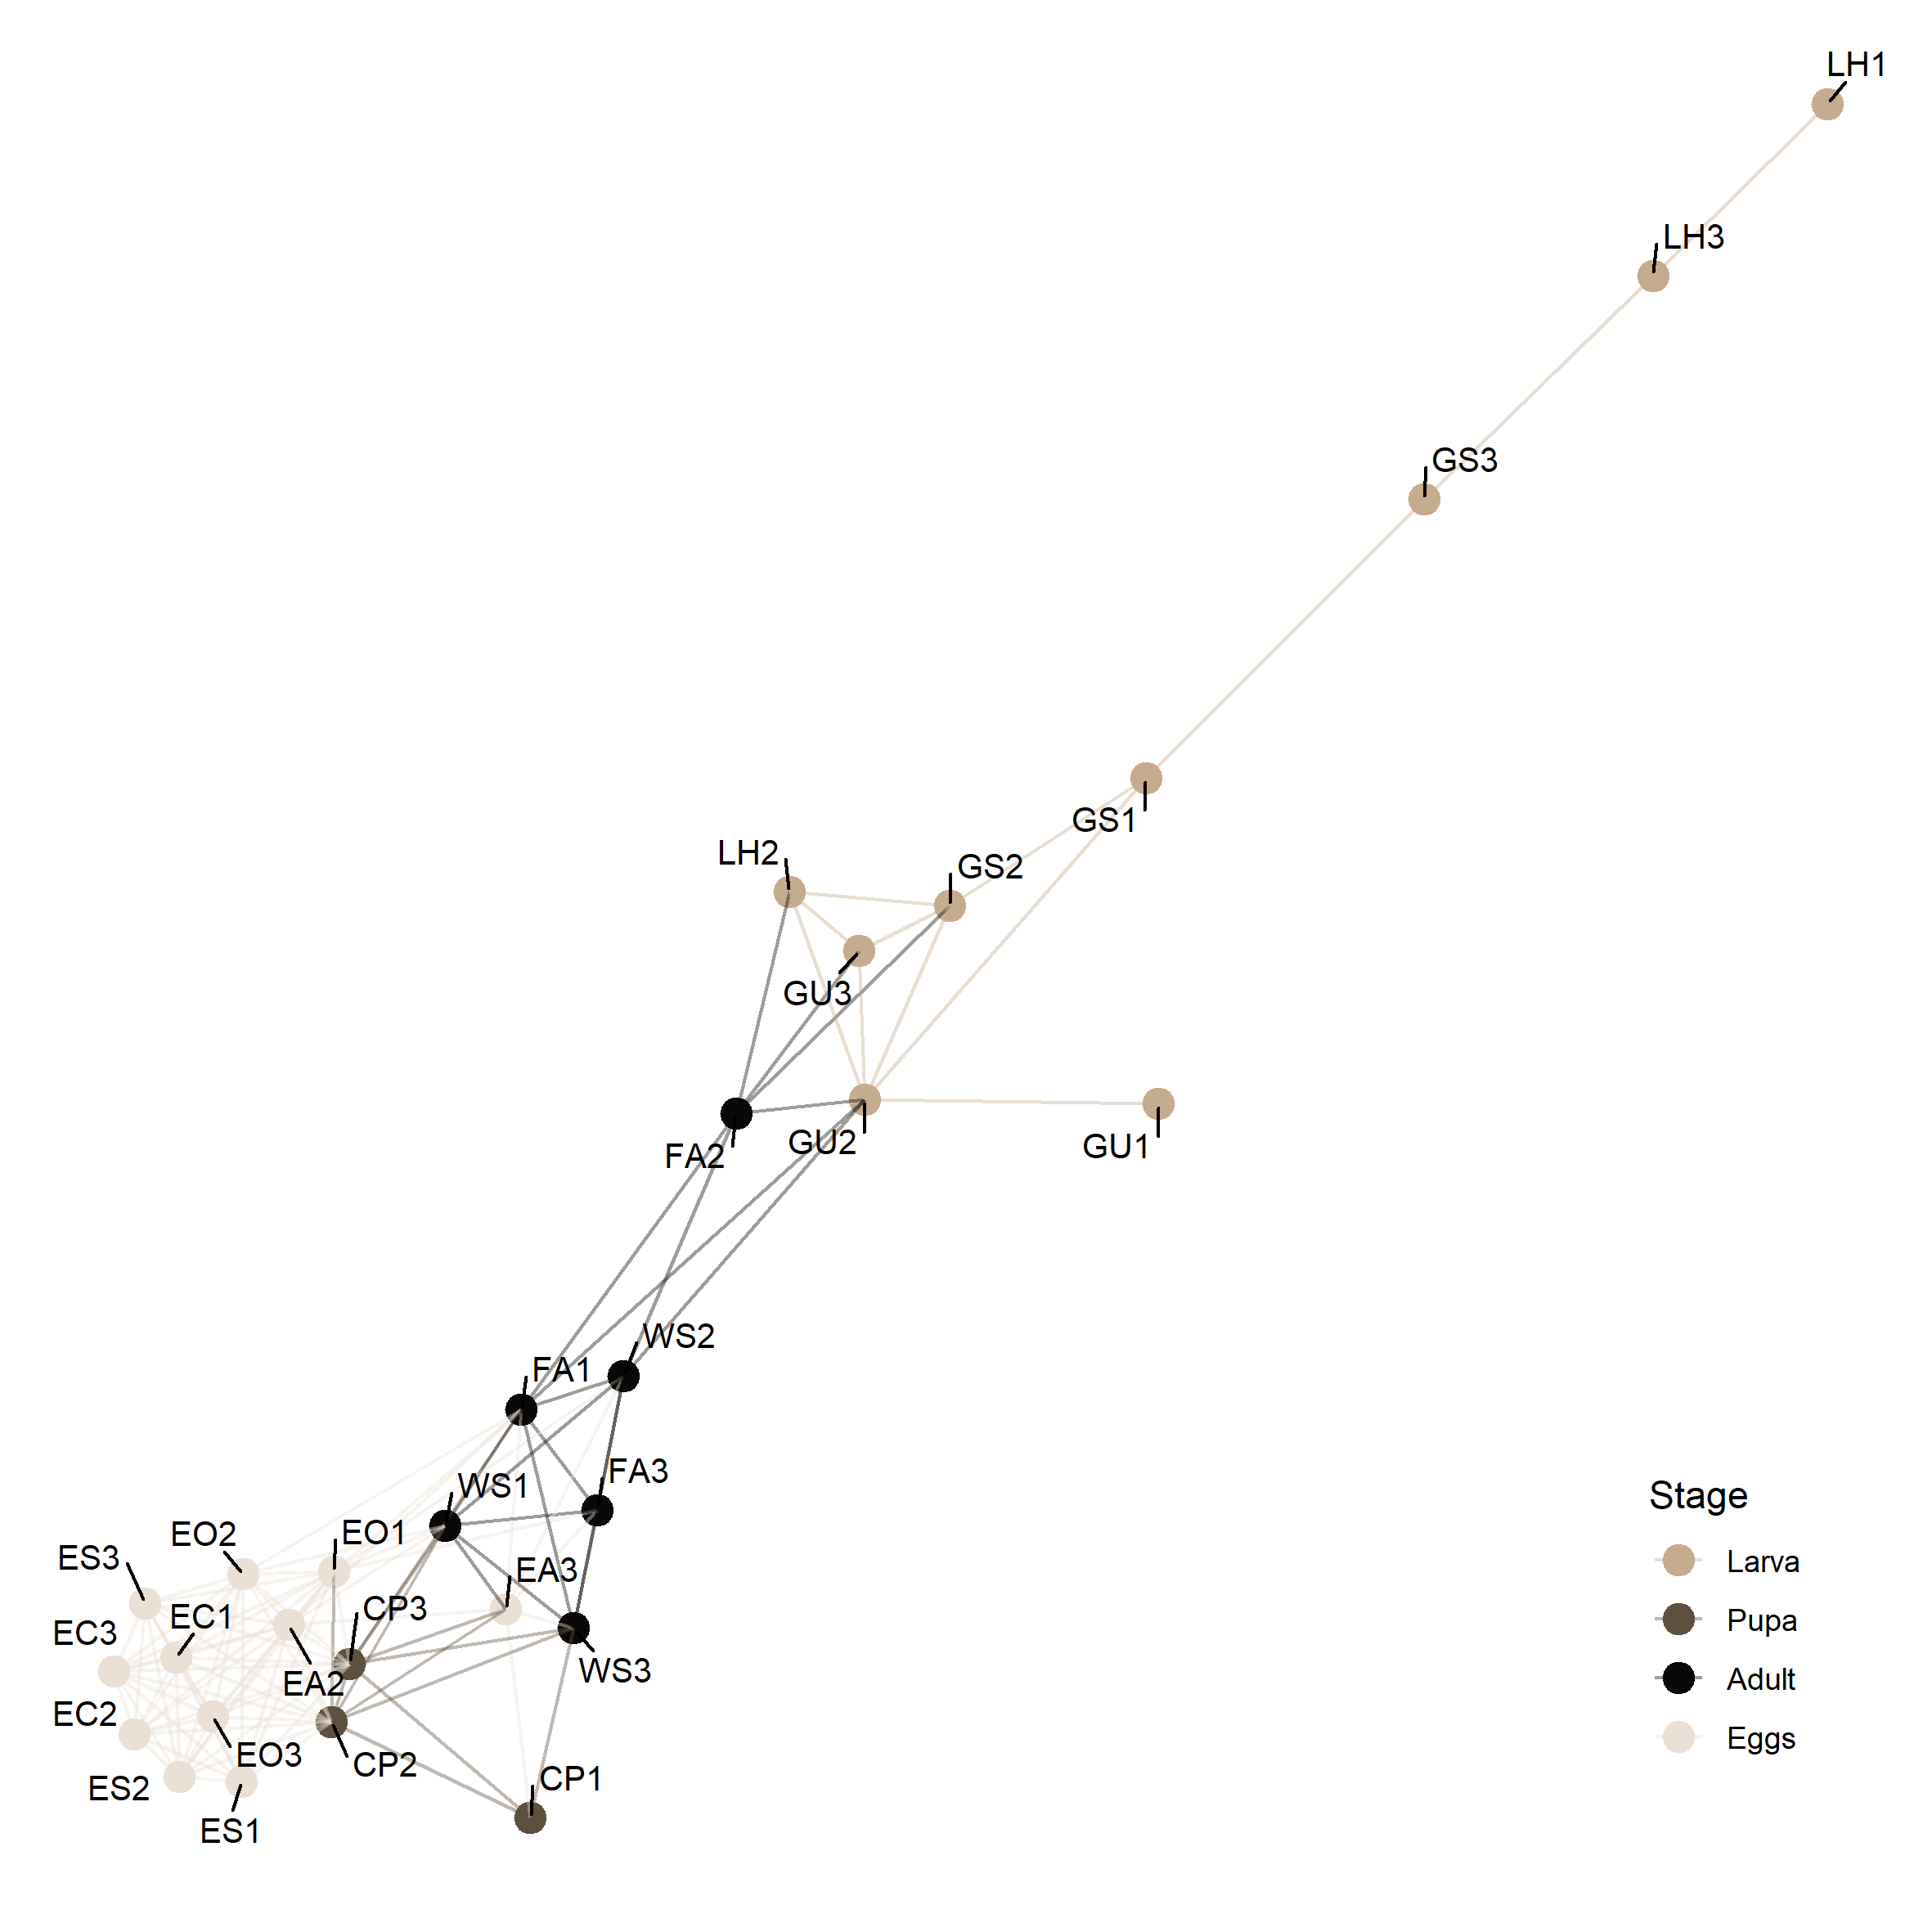
Supplementary figure 2 - Microbiome network based on Bray-Curtis
distance calculated for each sample, using a maximum ecological distance
of 0.5 as connection threshold (max.dist=0.5).
click figure to see larger version


